
Revenue by period
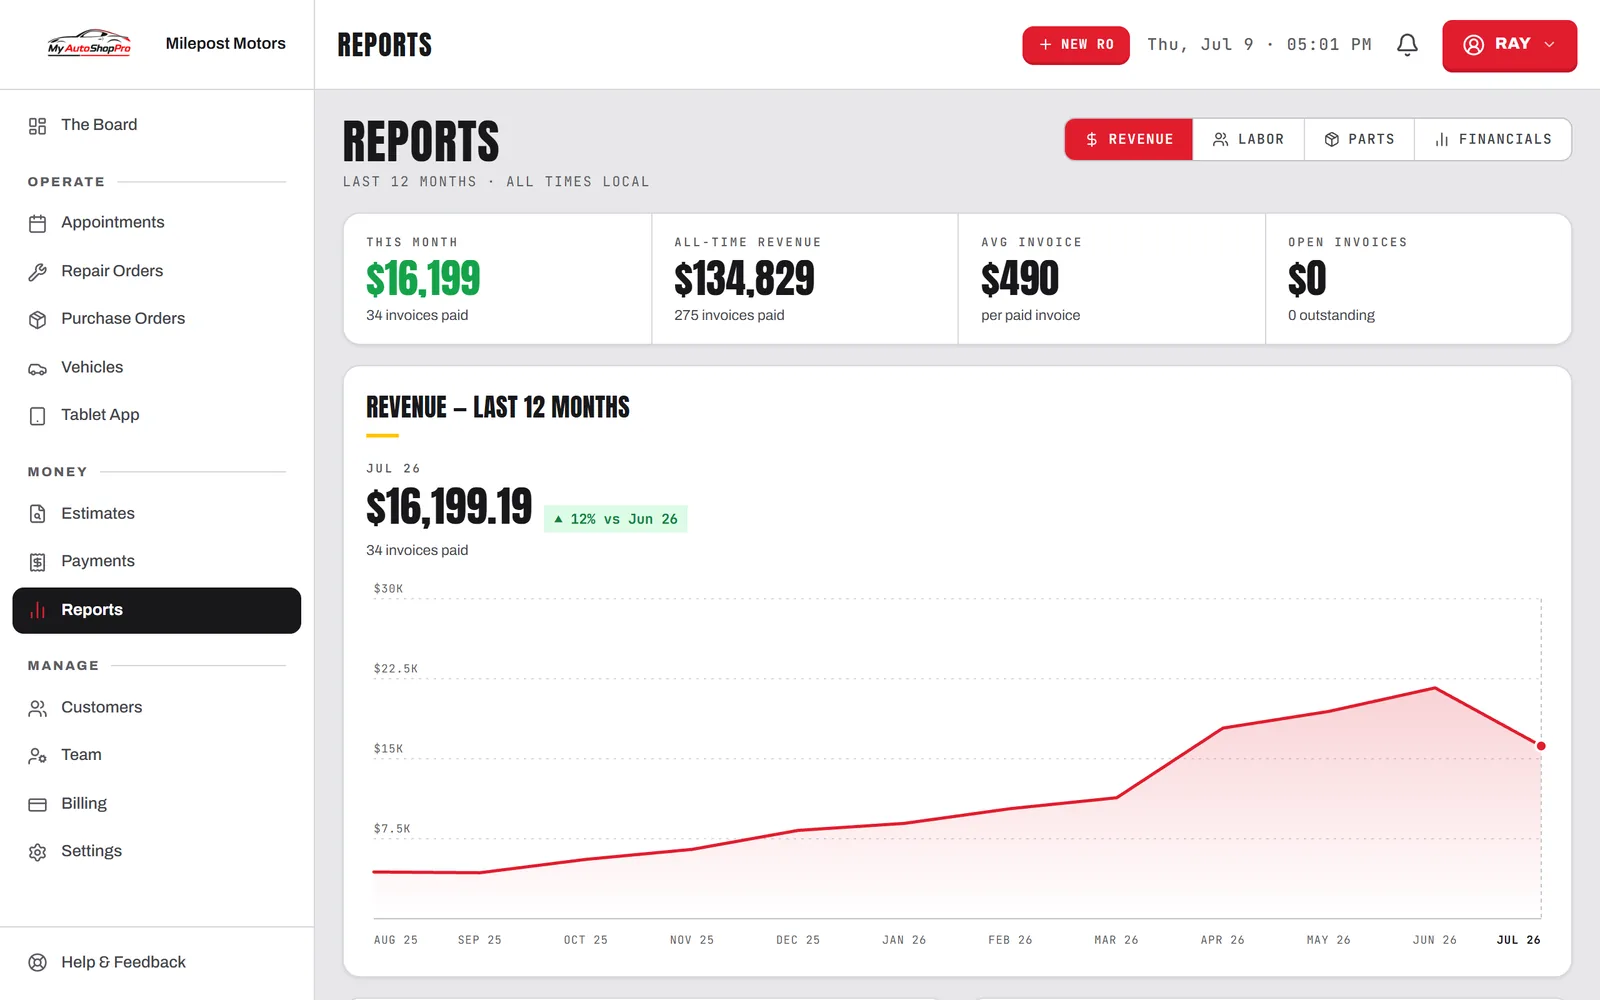
Weekly, monthly, and 90-day views off the same repair orders you already closed, so a slow stretch shows up while there's still time to do something about it.
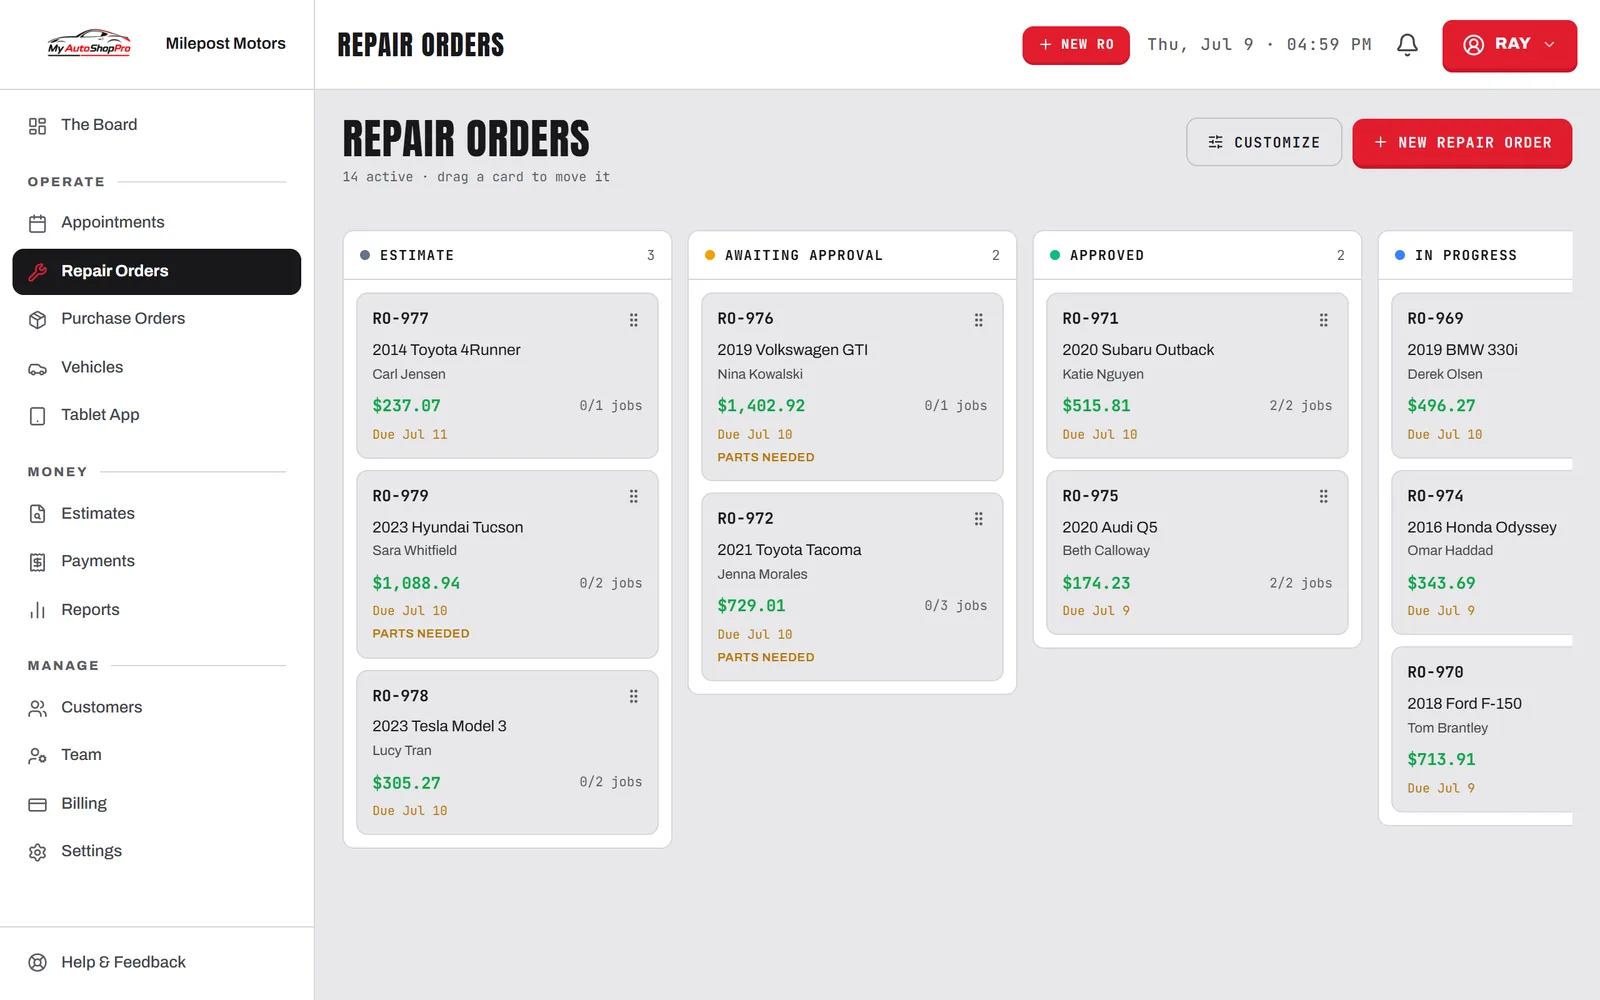
Reports & Analytics
Revenue by week or month. Top-earning services. Technician output. Everything you need to make smart decisions, built in and ready without a spreadsheet.
Available on Pro and Business plans
Nothing extra to track
It's all built from the work you're already doing. Every report writes itself from your orders and invoices.
Weekly, monthly, and 90-day views off the same repair orders you already closed, so a slow stretch shows up while there's still time to do something about it.
0setup
reports build themselves from your existing orders and invoices. There's nothing to configure.
Know which services make you the most money so you can promote them harder.
Is your shop growing? The trend line makes it obvious at a glance.
Understand when your shop is busiest so you can staff appropriately.
Jobs completed and revenue per tech, from the same board they're already working off. Motivate your best, support the rest.
The P&L tab pulls gross profit from paid repair orders, so a heavy month that didn't pay can't hide behind a big revenue number.
Reports
Last 12 months · all times local
Revenue — last 12 months
Top services by revenue
Busiest days
Your numbers, always up to date, and never once entered by hand.
Work to numbers
Repair orders get written, parts get added, invoices get paid. That's the entire data-entry step, and you were doing it anyway.
Revenue, top services, tech output, and busiest hours are read straight off that work. Nothing to configure and nothing to import.
Look at this week, this month, or the last 90 days, and compare it against the one before it.
Staff the busy days, push the services that actually carry margin, and catch a slow month in week two instead of at tax time.
Your best month starts with understanding your last one. Reports are included on Pro and Business.